Nifty 50 19,543.25+135.00   +0.65%
Bank Nifty 44,235.80-135.00   -0.20%
Sensex 72,845.70+135.00   +1.50%
Nifty 50 19,543.25+135.00   +0.65%
Bank Nifty 44,235.80-135.00   -0.20%
Sensex 72,845.70+135.00   +1.50%

Not Sure Where to Invest ?
We'll Guide You
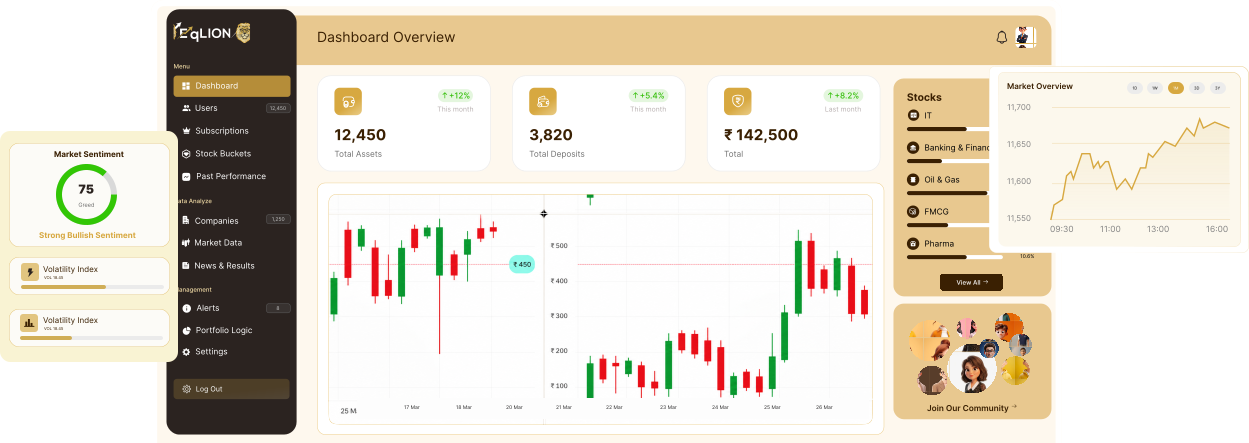
We convert complex financial data into one clear decision for smarter investing.

EQLion Dashboard

Discover Investment Buckets

Curated stock buckets of fundamentally strong businesses based on growth, valuation, and financial strength.

18.67%

Defence Gems

Strategic Defence Sector
High-potential defence stocks with strong government contracts

HAL BEL PARA
Risk Icon Moderate RiskInvestment Icon Min. ₹5,000
18.67%

Defence Gems

Strategic Defence Sector
High-potential defence stocks with strong government contracts

HAL BEL PARA
Risk Icon Moderate RiskInvestment Icon Min. ₹5,000
18.67%

Defence Gems

Strategic Defence Sector
High-potential defence stocks with strong government contracts

HAL BEL PARA
Risk Icon Moderate RiskInvestment Icon Min. ₹5,000

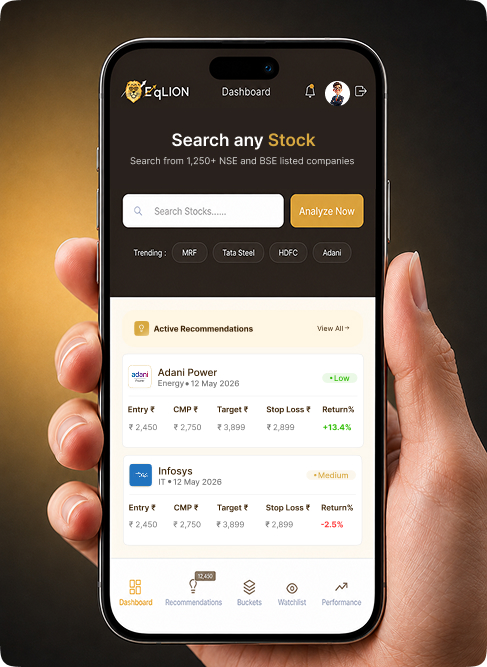
Data-Driven Stock Recommendations.
Transparent Track Record.

Every recommendation is backed by strong Fundamentals & Technical analysis. Performance is reported transparently.

LIVE Price Tracking AI Based Alerts Portfolio Sync

Today's Market Overview

Stocks driving today's market

Explore All
Results Radar Icon

Results Radar

Recent and Upcoming Results

DeclaredUpcoming
Recently Announced Results
Announced in the last 7 days

No recent results.

Upcoming Results
Next Earnings Announcements

No upcoming results.

Market Overview

A quick view of market sentiment, indices, and institutional activity.

Market Icon
Market Sentiment

Current Market Mood

Strong Bullish Sentiment

Graph Icon
Nifty 50
+0.65%
19,543.25
Graph Icon
Bank Nifty
-0.20%
44,235.80
Graph Icon
Sensex
+0.65%
65,782.50
Graph Icon
FII Activity (Daily)
Net Position
—
Buy Inflow
—
Sell Outflow
—
Net Flow—
Graph Icon
DII Activity (Daily)
Net Position
—
Buy Inflow
—
Sell Outflow
—
Net Flow—
Graph Icon
Institutional Activity (MTD)
FII Investment (MTD)Net Buying
—
DII Investment (MTD)Net Buying
—
Net Market Flow
—
Results Icon
Advance / Decline Ratio
2.45
Advancing Stocks1458
Declining Stocks594
Unchanged128
Graph Icon
52-Week High/Low
234/89
New 52-Week Highs234
New 52-Week Lows89
Ratio2.63
Graph Icon
Market Turnover
₹89,456 Cr
Cash₹67,234 Cr
F&O₹22,222 Cr
vs Avg+12%

Our Bucket Performance

Track historical trends and analyze performance metrics

Stock NameFrom BucketRec. DateEntry PriceTotal GainsStatusDuration
No performance records to show yet.

Choose How Deep You Go

Every plan gives you real research, not tips. Pick the depth you need and move up when you're ready.

What You Get

Everything you need to make informed investment decisions

  • Curated Stock Buckets

    Pre-researched collections of high-potential stocks across sectors

  • Results & Corporate Actions

    Real-time updates on earnings, dividends, and major corporate events

  • Watchlists & Alerts

    Create custom watchlists and get alerts for price movements

  • Fundamental & Technical Analysis

    Comprehensive analysis combining both fundamental and technical indicators

  • FII/DII & Market Insights

    Track institutional money flow and understand market sentiment

  • Transparent Track Record

    Full transparency on past recommendations with verified results
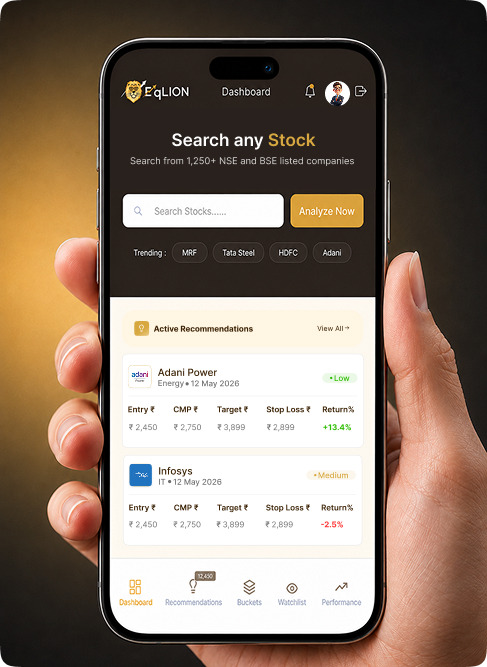
Mobile App DashboardMobile App Dashboard

Start Building Your Watchlist

Track your favorite stocks and get real-time alerts on market movements. Never miss an opportunity.

Live Price Updates Smart Alerts Portfolio Sync